Getting Started
Let's discover mockseries in less than 5 minutes 🚀
1. Install mockseries#
2. Create a timeseries generator#
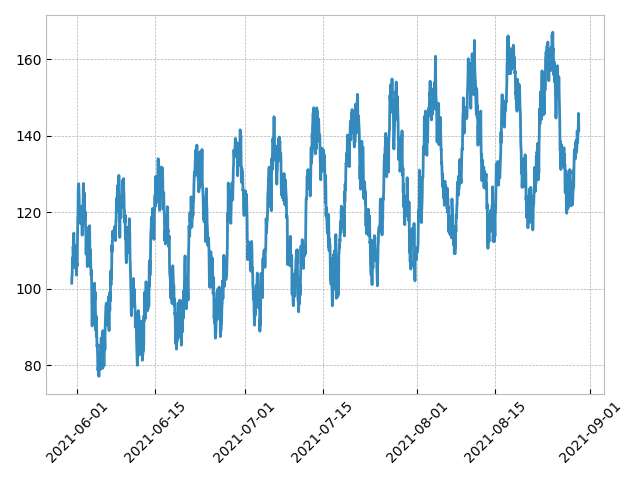
A timeseries can be expressed as a combination of 3 components: trend, seasonality and noise.
The trend is the long term, average change of the timeseries, such as the increase in CO2 emissions.
Seasonality is a cyclic pattern in the timeseries, such as the impact of the day-night cycle.
Noise represents irregular and random changes of the timeseries.
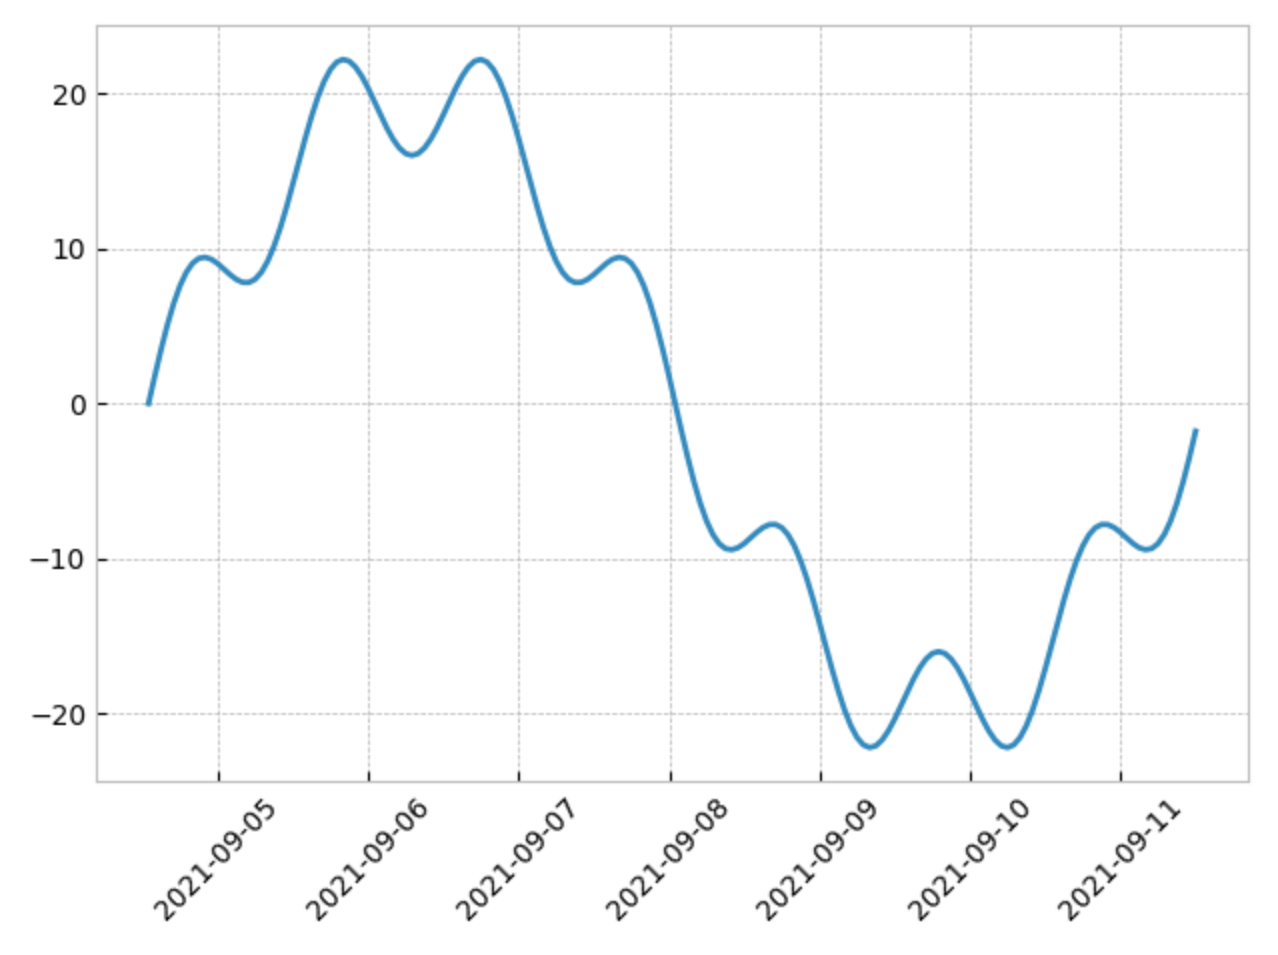
Here, 2 seasonalities with a different period are combined. It's as easy as an addition !
Many types of trends, seasonalities and noises are available.
Just combine them with the operators +, - and *.
3. Preview#
Quickly plot your signals
4. Generate values#
Sample your timeseries on a timeframe.
datetime_range helps you get the time points of a given granularity in a timeframe.
For instance:
timeframe of 1 hour, with a granularity of 1 minute: 60 points;
timeframe of 1 hour, with a granularity of 1 second: 3600 points.
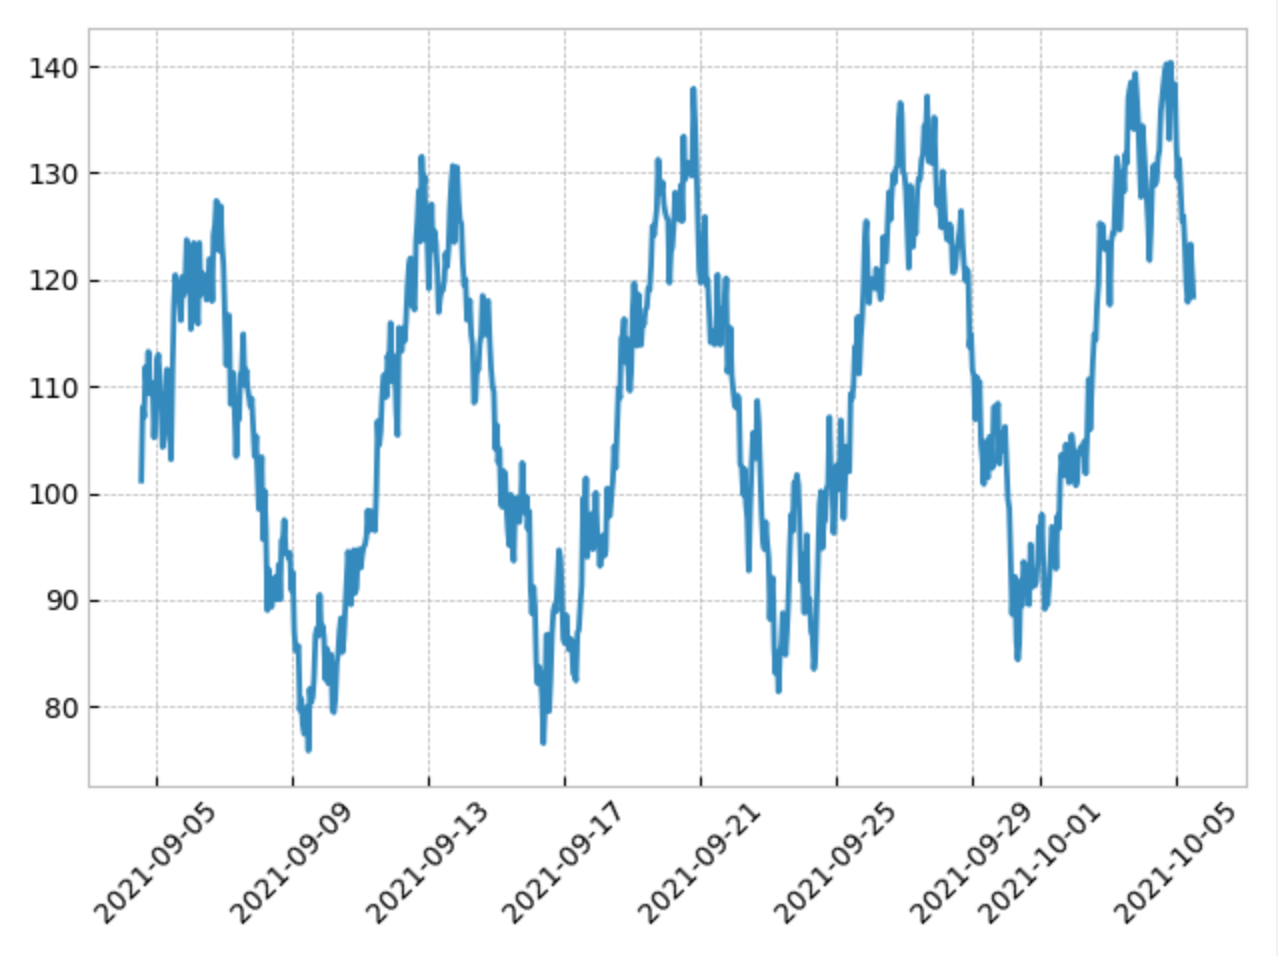
5. Plot or write to csv#
You will get something like this:
Now it's your turn !
Go to the next page to learn how to combine signals.
Go directly to the API Reference to checkout the available types of trends, seasonalities and noises.